Optimize your public transport offer
Elevate transit operations with data insights & business intelligence
Equans enhances your reporting and KPI tracking, simplifying data analysis through visually detailed presentations. Streamline your operations, meet NTD reporting requirements, and optimize investments for the growth of your public transit system.
Operation data analysis
Data analytics tools provide the visibility needed to make the changes that improve efficiency and optimize operations. Providing historical and daily operations reports. View actual vehicle speeds, run times, dwell times and more.
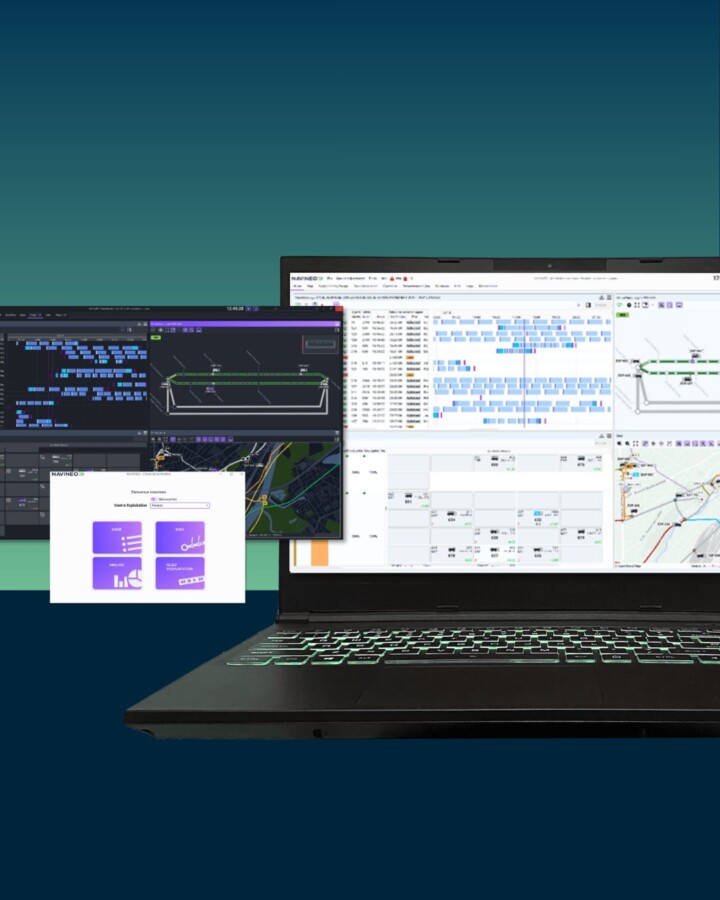
Statistics provided by the NAVINEO CAD/AVL
NAVINEO Dashboard
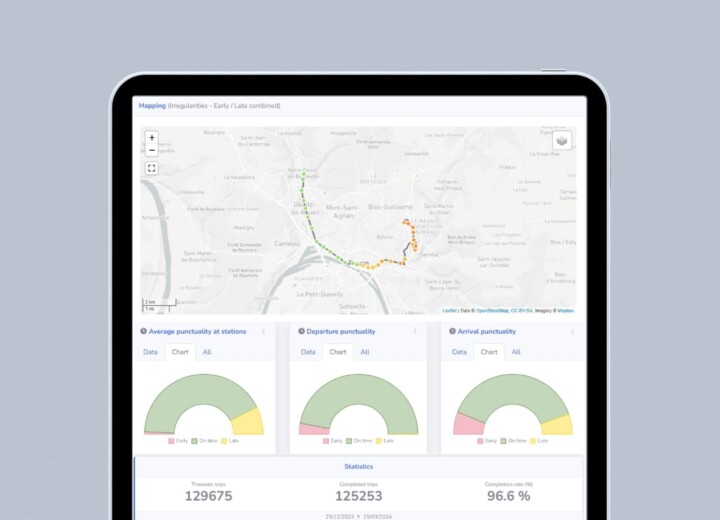
NAVINEO Dashboard consolidate all data into a single web-based data analysis and visualization platform.
Intuitive access to the CAD/AVL and RTPI data:
- Performance
- Production
- Travel time
- Ridership
To facilitate daily analysis for all teams, visualize key data, and contribute to better informing riders.
NAVINEO Dashboard functionalities
NAVINEO asset management platform (NAMP)
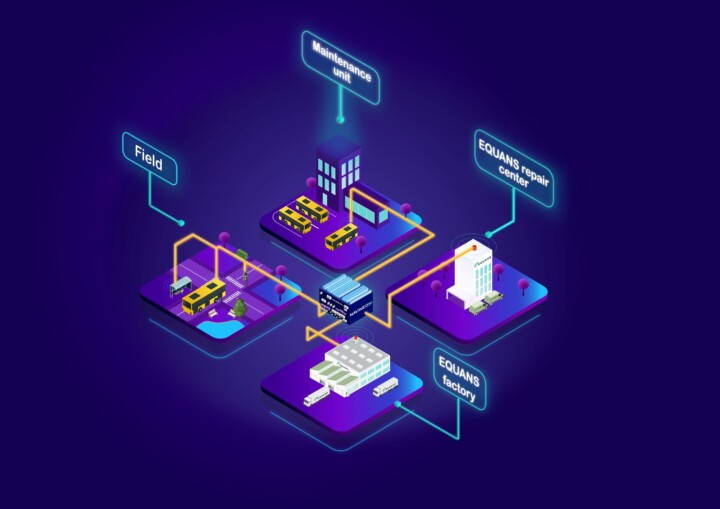
NAMP is a SaaS solution primarily designed for operators and maintenance centers. It tracks the status and location of computers within a fleet. The platform consists of three modules:
NAVINEO provides a reliable APC Hardware and Software solution for collection and data analysis of the counting data. The data provided by the APC system gives administrators the ability to plan according to the actual ridership demands, resulting in improved customer service and the efficient use of transit personnel and vehicles.
Benefits
- Trace the movements of NAVINEO computers for precise fleet monitoring (daily maintenance tracking) for operators and/or owners of the computers.
- Access key indicators at any time for increased transparency and clarity, minimizing unforeseen service interruptions for operators.
- Manage the life cycle to understand the state of the computer fleet.